Methodology Behind the Data Dwellers

1.0 Introduction

This will be a bit technical, no biodiversity here, but I want to get this down in print. What is “this”? Well, the story and methodology behind Data Dwellers and my journey into data analytics. I will keep it short, because it will be text-only … let’s get cracking.

2.0 Personal Story

I recently started on this data analytics journey and have picked up, or improved, skills like Excel, SQL, Tableau visualisations and the R programming language using RStudio. These are the basics you need and for future Data Dwellers posts I’ll probably have to use all those tools. For example, I’ll use Tableau to create a dashboard with some nice-looking visuals that might get people more interested in what I have to say.

The data analytics basics were picked up through Google’s Data Analytics course. An awesome online learning experience. Hard work, but highly recommended if you are interested in this topic.
I’ve specialised in Sports Data Analytics through a course at the Johan Cruyff Institute. For those who don’t know, Johan Cruyff was a famous football/soccer player from The Netherlands who played for Ajax and Barcelona (where the JCI is located). It was a great experience, and the course instructor was inspirational, he really helped me out a lot and provided great feedback to the work I handed in. The main benefit was using my general skills and applying them to a specific topic, football in this case.
Then, I also did an online course for Statistics which was given by Stanford University. Hah, not for the faint of heart and I’m super proud of myself for passing this.

I’ve always had an interest in data, statistics, and numbers. So, why not take my new skills and apply them to biodiversity!?! But how do I approach data and what do I do with it to get it ready for you the reader? …

3.0 The Methodology

Having acquired these skills and a passion for data analytics, I embarked on a journey to apply them to biodiversity. The following methodology outlines the steps I take to analyse and present the data effectively. For each species I highlight in this series, the end result will be slightly different.

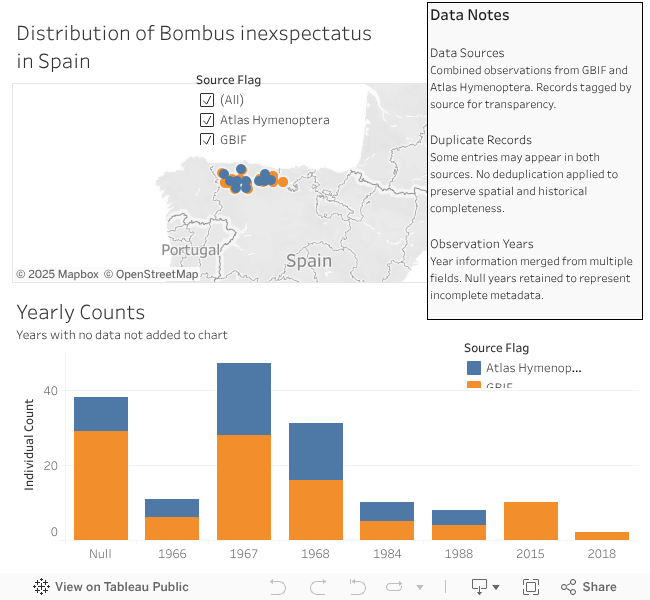
  • I’ll need to find a good source for data, which include repositories like the GBIF, Atlas Hymenoptera, and others.
  • Then I’ll need to clean up the data. Most data files for species will have 1000s of observations from across the world. However, the focus of this blog is Cantabria, so I’ll at least have to focus the data down to Spain only.
  • After that, the goal is to analyse what is there, are there any issues with the data? What are the limitations? There will be a host of questions to answer, and I’ll make sure to touch on them in the posts.
  • A story will need to be developed … what is the data telling us? Is it the data that is interesting, or is the more interesting aspect the data that is “missing”? “Missing” data can be interesting for rare species because there will be so few observations of them, so can those lead us to possibly go out and look for the species in areas where we currently do not have observations recorded for them?
  • Make some visualisations using Tableau and RStudio.
  • Write up the blog post.

4.0 Next Steps …

So, the next steps are to write up a number of posts. The goal is to link these Data Dwellers posts into a specific species post found in Fly Facts etc. However, some of the more interesting Data Dwellers subjects probably won’t have a species post yet, because they are rare species that I’ve not yet seen.

I have a lot more to say, so if you are interested, then let’s get a conversation going in the comments section of this post.

Methodology Behind the Data Dwellers

Introducing the Data Dwellers

Small Observations, Big Possibilities

Sometimes a bumblebee lands on a flower. Sometimes it lands on a map.

Over the past year there have been a number of significant changes in my life, which include a move and diving into a new area of knowledge; Data Analytics. However, one constant has been nature observation. If you decide to take the plunge with me, I’d like to slowly start incorporating these aspects into a new series —one part data, one part nature observation. This series, Data Dwellers, is about the quiet footprints organisms leave across landscapes, and how every recorded sighting builds the bigger picture. Whether it’s a beetle in a field, a dragonfly over a pond, or a butterfly zigzagging through nettles—these aren’t just wildlife moments. They’re coordinates, timestamps, and opportunities.

I’ll be keeping this first entry light, but here’s what you can expect from future posts:

  • Mini-Profiles: Exploring species you might stumble upon, grounded in data and ecology.
    • Data Deep Dives: Looking at patterns, gaps, and what citizen-collected data can reveal about regional biodiversity.
    • Behind the Numbers: Explaining how digital ecosystems (like Observation.org or GBIF) track nature—with all its quirks and blind spots.

Each entry will be tailored to the species I’ll cover, some might benefit with a deep dive into the data available, whereas others will explore issues found within the data available. Furthermore, each entry will compliment posts in the other regular series such as Fly Facts, Butterfly Bulletin, Odonata Update, and more.

1.0 First Glimpse: Bombus inexspectatus in Spain

Here’s a simple visual example of what I mean. I’ve built a dashboard that combines observations of Bombus inexspectatus—a rare bumblebee—from two public datasets. It’s not flashy, but it starts to tell a story and it provides us a basis for excursions and goals we have to see if we can observe the species ourselves out in the wild.

I‘ve not yet been able to embed the dashboard here (yet), but below is an image with a link to that dashboard. The dashboard is interactive and will update by itself if I make any changes to it in the future. Feel free to zoom in on anything that might interest you, check or uncheck boxes, hover over observations or bars in the bar chart for more information.

Bombus_inexspectatus Dashboard

Fig 1. – Link to a Tableau Dashboard of Bombus inexspectatus observations. Data from Atlas Hymenoptera and GBIF. Click on the image to visit the dashboard in a new tab.

Dashboard Notes

  • Mapped Observations: You’ll see locations pulled from GBIF and Atlas Hymenoptera—both great resources with different strengths. I’ll post links below.
  • Yearly Counts: Even sparse data can show patterns (or silences). Why the jump in 2015? Why nothing recent? Questions like these guide deeper research.
  • Data Gaps: Some records are missing timestamps or counts. I’ve kept these in to reflect the reality of citizen science—messy, imperfect, but meaningful.

I’ll cover these questions in future Data Dwellers posts on specific species, as well as in a Data Dwellers post where I’ll cover my work methodology.

2.0 Why This Matters

In a way, species like Bombus inexspectatus are digital ghosts. We know they exist—or existed—but they flicker in and out of view depending on where people look, what they record, and how they choose to share it. This is where Data Dwellers finds its pulse: in the tension between the known, the visible, and the speculative.

As I mentioend above, I’ll be posting new entries under this series—sometimes short snapshots, other times deeper dives. And if something sparks curiosity along the way, feel free to reach out or leave a comment. Nature isn’t just for scientists, and neither is data.

3.0 Links

Each time I create a new dashboard for a species, I’ll be using various sources. One will usually be GBIF, which requires that you provide a link to the data used.

Atlas Hymenoptera – Great source on bees in Europe. The link it to the species-specific page.

GBIF – An open access database with biodiversity information. See here the citation you are required to add:

Creuwels J (2017). Naturalis Biodiversity Center (NL) – Museum collection digitized at storage unit level. Naturalis Biodiversity Center. Occurrence dataset https://doi.org/10.15468/17e8en accessed via GBIF.org on 2025-07-14.

Praz C, Müller A, Hermann M, Neumeyer-Funk R, Bénon D, Amiet F (2025). Swiss National Apoidea Databank. Version 1.7. Swiss National Biodiversity Data and Information Centres – infospecies.ch. Occurrence dataset https://doi.org/10.15468/ksfmzj accessed via GBIF.org on 2025-07-14.

Bakker F, Creuwels J (2025). Naturalis Biodiversity Center (NL) – Hymenoptera. Naturalis Biodiversity Center. Occurrence dataset https://doi.org/10.15468/jgywgc accessed via GBIF.org on 2025-07-14.

Inventaire National du Patrimoine Naturel (2020). ATBI Parc national du Mercantour / Parco naturale Alpi Marittime-Jeux de données provenant de l’ATBI dans le Parco Naturale Alpi Marittime (Italie). UMS PatriNat (OFB-CNRS-MNHN), Paris. Occurrence dataset https://doi.org/10.15468/wzwus6 accessed via GBIF.org on 2025-07-14.

Orrell T, Informatics and Data Science Center – Digital Stewardship (2025). NMNH Extant Specimen Records (USNM, US). Version 1.96. National Museum of Natural History, Smithsonian Institution. Occurrence dataset https://doi.org/10.15468/hnhrg3 accessed via GBIF.org on 2025-07-14.

Mañas-Jordá S, Acosta Rivas C R, Ariño Plana A, Baquero Martín E, Bartomeus I, Bonada N, García-Barros E, García-Meseguer A J, García Roselló E, Lobo J M, López Mungira M, López Rodríguez M J, Martínez Menéndez J, Millán Sánchez A, Monserrat V J, Prieto C E, Romo H, Sánchez-Campaña C, Tierno de Figueroa J M, Yela J L, Sánchez-Fernández D, González M, Bonada N (2025). IberArthro: A database compiling taxonomic and distributional data on Ibero-Balearic arthropods. Version 2.4. Department of Ecology and Hydrology. University of Murcia. Occurrence dataset https://doi.org/10.15470/pqq9oc accessed via GBIF.org on 2025-07-14.

Villares J M (2023). Inventario Español de Especies Terrestres (MAGRAMA). Version 1.5. Spanish Ministry for Ecological Transition and Demographic Challenge.

Occurrence dataset https://doi.org/10.15468/f0qd41 accessed via GBIF.org on 2025-07-14.

Introducing the Data Dwellers