1.0 Introduction
Time to get started on the first real Data Dwellers. The previous two posts were to introduce the series and give short highlights of the methodology behind the series.
In the first post (Introducing the Data Dwellers) I already gave a first glimpse of the species we’ll cover today. What you read here will be the basic outline that each Data Dwellers post will follow. It will include a short introduction to the species and then will highlight the data analysis process. What did I do with the data? Did I find anything interesting? What does the data show us? Can I make improvements in the future and are we missing something in the data?
To round it all off I’ll provide links, and references to the data used.
I have only recently started on my data analysis journey, so part of the process is me learning and documenting my work. You can see this as an extended portfolio, if anyone is interested in my skills they can come here and see what I’ve done and how I have done it.
So, to start, I needed a dataset that was manageable for my current competency level. I needed to find a species of bee or butterfly that would not have millions of data entry points (very common species will have millions of occurrences) so that I could easily review the work that I had done and see where I can improve or simplify my data analysis processes. Two bumblebee species were the first that popped into my mind … the blog’s namesake and a very rare species I have been interested in. Let’s take a closer look in the next section.
Key Takeaways
- The goal is to learn by doing and you as reader can follow along as we build our data analysis competencies while exploring insect species.
- Each post will have a similar structure. This spaced repetition learning technique will build up our base skills (continuous learning) and will make any anomalies stand out when we find them in future Data Dwellers posts.
2.0 Species Introduction – Bombus inexspectatus
I actually started on the blog’s namesake (Bombus cullumanus), and I’ve finished the work, but the dataset required quite a lot of cleaning, so I thought I’d leave that for a future post because I have to do more explaining around my data analysis processes. Let’s keep it relatively simple for a first time. This post is going to be a bit longer than usual – grab a coffee and settle in!
Bombus inexspectatus Tkalcu, 1963 is an extremely rare bumblebee species that can be found in the Cantabrian Mountains and the Alps (see the IUCN link below). The reason it is so rare is because it has an incredibly unique lifestyle. I know of one other bumblebee species like it, Bombus hyperboreus Schönherr, 1809, which is found above the Arctic Circle in Norway, Finland, and Russia. What makes this species so special is that the queens cannot make their own nests, but at the same time, they do not parasitize a host’s nest like a cuckoo bumblebee does. Cuckoo bumblebee queens kill or “dominate” the host queen, and the hive then thinks that the usurper is one of their own. Unknowingly, the nest starts rearing the cuckoo bumblebee’s eggs! Think of the Cuckoo bird, where the adult removes a host bird’s eggs (a Robin or Blackbird for example) from the nest and lays her own in it. The host bird then rears the Cuckoo’s egg to adulthood!
Bombus inexspectatus queens cannot make wax (to create the cells into which eggs are lain), so she enters a nest and needs to work with the host (in this case the species she relies upon is Bombus ruderarius (Red-shanked carder bee)). Also, she needs the host’s workers to forage for pollen because she cannot do that (nor any of her offspring). To make things even more difficult, Bombus ruderarius is not a common species in the Cantabrian Mountains, and Bombus inexspectatus bees look very similar to their hosts. This second aspect is why the species was only identified in 1963, and only years later it was confirmed that the two species I’ve mentioned here are connected (Hines & Cameron, 2010 – see below).
I have photos of a bumblebee that fits the coloration of Bombus inexspectatus, but they aren’t good enough for identification. So, I will not post anything until I have something that is certain.
Anyway, all of this means that there are very few observations of this species that we can analyse. The last registered observation is from 2018, with most prior observations coming from entomological collections where the bee was initially misidentified as B. ruderarius. Needless to say, this means that there could still be mislabelled specimens in some of the smaller entomological collections, or private collections, which would help bolster historical data. Given how elusive Bombus inexspectatus is, every data point matters. So, let’s dig into what’s available and see what patterns—if any—we can uncover through analysis.
Key Takeaways
- Bombus inexspectatus has an unusual lifestyle, where it must cooperate with the host.
- It is a very rare bumblebee species, both because it is difficult to identify and because its range is very limited.
- Most observations are historical, making citizen science and scientific fieldwork key to uncovering new data on the species.
3.0 Analysing the Data
3.1 First Steps
Bumblebee data for Europe can come from two main sources.
- Atlas Hymenoptera – you can download a .csv file per species. The main issue is that the data has not been updated since around 2013, and the type of data per observation is very limited, with only really the basics (location and date(sometimes)). The data comes from old scientific articles and from old collections.
- GBIF – a massive data repository. You can download a data package with lots of information per observation (if the people uploading the observation have decided to include it). GBIF includes all verified data from the website I use, Observation.org.
So, the first step is to remove most of the data columns (each row in a dataset is an observation), because many of the columns are empty (e.g. life stage), or have information that is not interesting to us (e.g., some of the taxonomy elements are too detailed).
The next step is to integrate both the Atlas Hymenoptera and GBIF data sets together. I add the AH data to the cleaned GBIF file and make sure to tag the imported data as coming from the AH so I can split it out later for visualisation.
Step three is to remove all data that falls outside of Spain, in this case all the observations in the Alps. Not that those aren’t interesting … but the blog is focused on Cantabria and the surrounding regions, and adding the Alps data might distract the reader. In future posts, I’ll need to decide if I keep the focus on this region of Spain or show the data for all of Spain.
3.2 Assumptions Made & Manipulation of Data
These are basic initial steps I do each time, I won’t highlight them in detail for each Data Dwellers post, but you can always ask below if you want to know more. The most important element are the assumptions I apply when I go to visualise the data.
For example, in this case, a number of observations in the dataset came with a NULL (this means nothing is entered in a cell in the database) or N/A in the column of counts of individuals observed. To resolve the issue around counts I decided to replace those NULLs with a “1”, so that it indicated that at least 1 individual was observed at that location. Reasoning being, why would you record an observation if you didn’t see anything? Keeping the count to “1” (and not “2” or “10”) meant that the data doesn’t skew towards those NULL observations and weights each equally, compared to the overall dataset.
Another decision I had to make was around data duplication. Combining both datasets meant that some observations could be counted twice because they are recorded in both the GBIF and Atlas Hymenoptera datasets.
For example, if you look at 1988, there are 4 observations in both datasets. However, on the map they aren’t in exactly the same spot. Keeping both in, allows the viewer to see any trend in each dataset (hence the different colours used to visualise them). The larger the datasets the less impact this will have.
Data counts is also the reason for not adding totals to each bar in the bar chart. For example, for 2015 the bar could have a number 10 above or in it. However, we aren’t really interested in totals per se, we’re more interested in trends (i.e., how does the height of each bar in the bar chart relate to the others?). I should not that with such low numbers of observations, any trends are quite speculative. Most people won’t be able to identify Bombus inexspectatus out in the field considering it looks so similar to other species. So, any large upticks are probably due to a focused effort to record bumblebee species by scientists.
I did not find any mistakes (yet) therefore we’ve reached the end of this section. Below is a picture of the dashboard and you can click it to link to the Tableau page where you can check it out.
For those of you who are new to dashboards, you can hover over things and additional information will pop up. For example, each dot on the map has some information about the observation (if anything was available). You can also zoom in on the map, move it around or uncheck observations from a certain source.
Now that we’ve visualised the data and explored some initial patterns, it’s time to think about what comes next—both in terms of improving the analysis and expanding the scope of future posts.
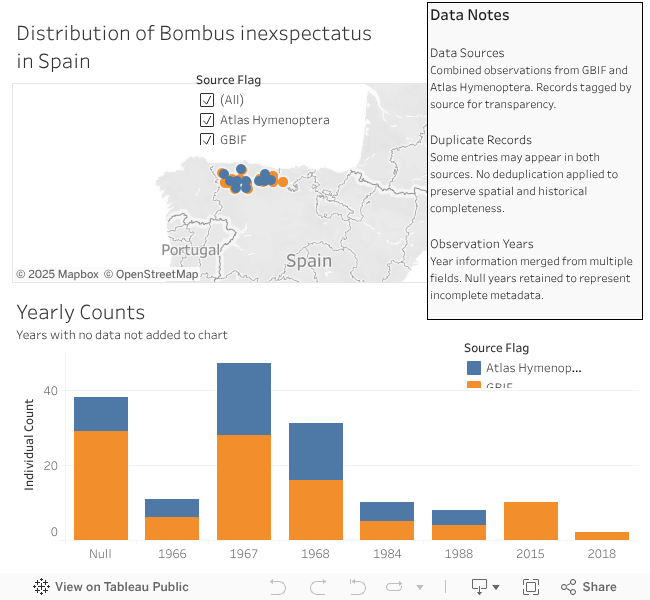
Fig 1. – Link to a Tableau Dashboard of Bombus inexspectatus observations. Data from Atlas Hymenoptera and GBIF. Click on the image to visit the dashboard in a new tab.
Key Takeaways
- Assumptions are key when analysing data. So, we have to be very clear about the assumptions that we are making.
- Two main sources of data were used. The focus has been on data showing the species’ presence in Spain.
- The goal here has been to visualise the data and to look for patterns over time and space. The result is the dashboard.
4.0 Next Steps …
As this project evolves, there are several exciting directions I’m planning to explore:
• Standardising the Dataset. The current Tableau dashboard works well, but the underlying dataset still has inconsistencies due to merging multiple sources. I’ll be refining the structure to ensure smoother integration and more reliable visualisations.
• Sharing My Workflow in R Markdown. I’m working on creating R Markdown documents to publish on my GitHub. These will walk through my analysis step-by-step, making it easier for others to follow, replicate, or even critique the process. It’s a way to open the door to collaboration and feedback.
• Learning from the GBIF Data Use Club. I’ll be attending the upcoming webinar on Mapping Occurrences hosted by the GBIF Data Use Club. Their previous sessions have already taught me valuable tricks—like using the taxonKey instead of the scientific name for more consistent searches. I’m excited to apply these insights to future posts, especially when I start diving into butterfly data.
• Exploring Alternative Mapping Tools. While Tableau has served me well so far, I’m curious about other platforms for species mapping. Depending on what I learn through GBIF and other sources, I may experiment with new tools to enhance the visual storytelling.
• Tapping into Cleaned Spanish Bee Data. I recently discovered a GitHub repository where someone has already cleaned and organised Spanish bee data from GBIF. I’ll be reviewing their work to see how it might complement or improve my own dataset. More updates on this soon.
If you’re following along and have thoughts, questions, or ideas—drop them in the comments. I’d love to hear from you and keep this conversation going.
5.0 Links
Hines & Cameron, 2010 – Research article on Bombus inexspectatus https://www.life.illinois.edu/scameron/publications/pdfs/HinesCameron2010.pdf
Atlas Hymenoptera data link http://www.atlashymenoptera.net/pagetaxon.aspx?tx_id=3016
GBIF downloaded dataset https://www.gbif.org/occurrence/download/0010366-250711103210423
GBIF Data Use Club https://www.gbif.org/data-use-club
IUCN Red List https://www.iucnredlist.org/species/13340462/57349805
Bumblebee Conservation blog post https://www.bumblebeeconservation.org/bumblebees-of-the-world-blog-series-7-bombus-inexspectatus/
Spanish Ministry for the Environment https://www.miteco.gob.es/content/dam/miteco/es/biodiversidad/temas/inventarios-nacionales/Bombus_inexspectatus_tcm30-198244.pdf
